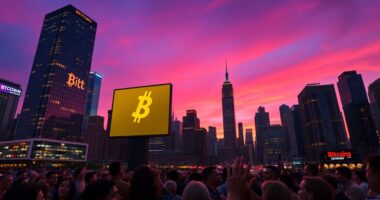
📊 Full opportunity report: AI And The Art Of Real-Time Battlefield Visualization on ThorstenMeyerAI.com — validation score, market gap, and execution plan.

Get business pricing on tech for your team
- Business-only prices and quantity discounts
- Tax-exempt purchasing
- Multiple users, one account, clear invoices
TL;DR
A project from isbitcoindead.com uses AI and browser tech to create a real-time, cinematic visualization of Bitcoin trading activity. It depicts market buy/sell battles as a war scene, providing an artistic view of market chaos without trading advice.
A browser-based visualization tool has been launched that renders live Bitcoin trades as a cinematic battlefield, using AI and cutting-edge web technologies. The project, developed by isbitcoindead.com, connects directly to Binance and Coinbase streams to generate a continuous, immersive visual experience. This development highlights how advanced browser capabilities can be harnessed for artistic and data-driven representations of market activity, without involving trading functions or advice.
The visualization, called Bitcoin War, transforms each trade into a combatant on a dynamic battlefield, with buy orders represented as advancing forces from the left and sell orders from the right. Large liquidations are visualized as airstrikes, and the entire scene is rendered using Canvas 2D graphics, WebAudio synthesis, and real-time stream processing, all client-side and without backend infrastructure. The system features an automatic camera that shifts perspectives, a live volatility meter, and a scrolling war log narrating ongoing market activity. It is accessible instantly in any modern browser and is designed purely as an artistic depiction, with a footer explicitly stating, “a live reading of the BTC/USDT tape · no advice, only war.”
According to the creators, this project aims to demonstrate how web technologies can produce immersive, artistic visualizations of complex data, rather than serve as a trading tool or provide financial advice. The project is free to access and offers a visceral, cinematic view of Bitcoin trading chaos, emphasizing the raw, unpredictable nature of markets.
Implications of Artistic Market Visualization
This development underscores the potential of AI and browser-based technologies to create compelling, real-time visualizations of financial markets, opening new avenues for data art and education. While not designed for trading, such tools can help viewers better understand market volatility and dynamics through immersive, visceral experiences. It also demonstrates how advanced web tech can be used for creative purposes without heavy infrastructure, making complex data accessible and engaging for a broad audience.
Products Worth Considering

LG UltraGear 34GX90SA-W 34-inch WQHD Curved OLED Gaming Monitor

Samsung Odyssey G4 25-inch FHD Gaming Monitor

LG UltraGear 32GX850A-B 32-inch 4K UHD Glossy OLED Gaming Monitor
As an affiliate, we earn on qualifying purchases.
Background of Market Visualization Innovations
Traditional market data visualization relies on charts, graphs, and dashboards, often requiring specialized software and technical expertise. Recent advances have seen efforts to make these visualizations more immersive or artistic, but most remain confined to analytical use. The launch of Bitcoin War by isbitcoindead.com marks a shift toward artistic, cinematic representations driven by AI and web tech, reflecting broader trends in data art and real-time visualization. The project builds on existing capabilities of WebSocket streaming and client-side rendering, showcasing how modern browsers can handle complex, real-time data without server-side processing.
“This project illustrates how web technologies can be used for artistic and educational purposes, providing a visceral view of market chaos.”
— an anonymous researcher
Unconfirmed Aspects of Market Impact and Usage
It is not yet clear whether similar visualizations will be adopted for broader educational or artistic projects, or if they could influence trading behaviors. The long-term impact on market perception remains untested, and there is no evidence that such tools will be integrated into trading platforms or decision-making processes. Additionally, the extent to which viewers interpret the visualization as a reflection of market reality versus an artistic depiction is still uncertain.
Future Developments and Potential Expansions
Developers may expand this project with additional features, such as more detailed analytics or interactive elements, to deepen engagement. There is also potential for similar visualizations to be applied to other markets or data streams, broadening the scope of artistic data representation. Monitoring user feedback and technological advances will determine if these visualizations evolve into educational tools or creative installations, or remain primarily artistic expressions.
Key Questions
Is this visualization intended for trading decisions?
No, the project explicitly states it is not a trading tool and does not involve financial advice or signals.
How does the visualization work technically?
It connects directly to live trade streams via WebSocket, rendering each trade as a combatant on a dynamic battlefield using client-side web technologies like Canvas 2D and WebAudio.
Can I access this visualization easily?
Yes, it is available for free in any modern web browser at war.isbitcoindead.com, with no installation required.
What is the purpose of this visualization?
Its goal is to provide an artistic, visceral view of market activity, illustrating the chaos and intensity of Bitcoin trading rather than serving as a trading aid.
Source: ThorstenMeyerAI.com