
🔍 Read the full analysis: A Look At OlmoEarth V1.3 And Its Embeddings For The Entire Planet on ThorstenMeyerAI.com

Get business pricing on tech for your team
- Business-only prices and quantity discounts
- Tax-exempt purchasing
- Multiple users, one account, clear invoices
TL;DR
The OlmoEarth team has released v1.3 of its satellite embedding model, annual global embeddings at 10-meter resolution, and a browser-based map explorer. The team reports that its 128-dimensional version ranked highest on 20 of 27 evaluations, but those results have not been independently verified in the supplied material.
The OlmoEarth team has released version 1.3 of its satellite embedding model, as described in the original analysis, together with annual global data at 10-meter resolution and a browser-based explorer. The team says its 128-dimensional embeddings ranked highest in 20 of 27 evaluations, while a 64-dimensional version led in 18; the results are the developers’ own findings and are not independently verified in the supplied source material.
OlmoEarth v1.3 processes yearly satellite time series using Sentinel-1 radar and multispectral imagery from Sentinel-2 and Landsat. For each 10-meter pixel, the model produces a 128-number vector, or embedding, that represents information learned from the imagery. The first 64 dimensions can also be used as a smaller representation. The precomputed global data is available through Source Cooperative, according to the release description.
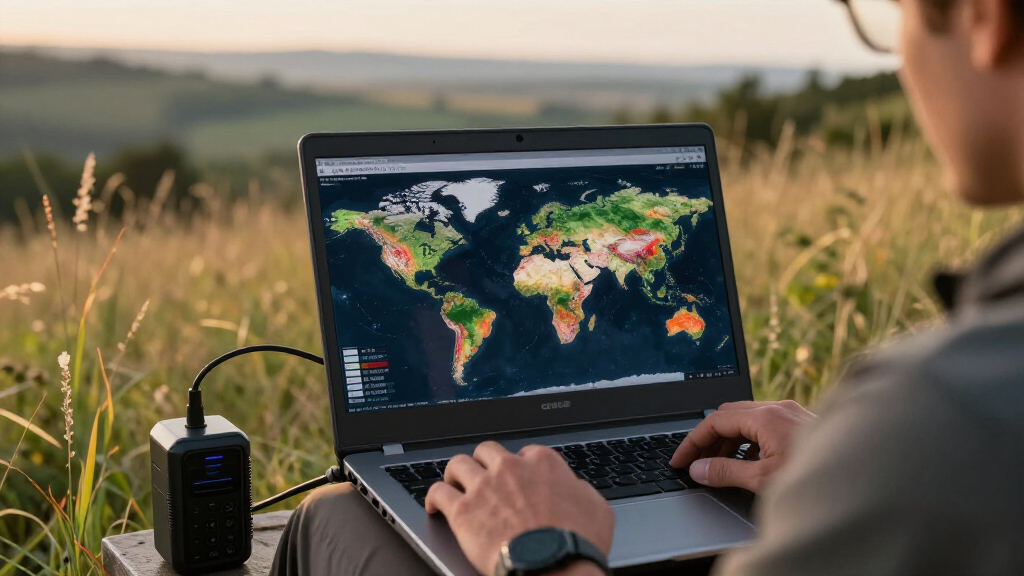
The release also includes the OlmoEarth Embeddings Explorer, a browser-based map tool. Users can view embeddings as false-color maps, switch between years, compare the maps with underlying Sentinel-2 imagery, and select locations to find visually similar places. The team says users can also add labeled points and train a small classifier, without signing in or needing advanced technical knowledge.
In the team’s comparison with AlphaEarth Foundations and Tessera v2, the 128-dimensional embeddings ranked highest on 20 of 27 evaluations, and the 64-dimensional version ranked highest on 18. The team says the evaluations covered multiple tasks across six continents. It also introduced PLANTEUR, a benchmark focused on crop types in tropical farming, and reports that OlmoEarth embeddings generalized best to locations not seen by the classifier during training. The technical report contains the team’s methods and full results.
Lowering Barriers to Satellite Mapping
Precomputed embeddings could reduce the work needed to use satellite data for land-cover classification and change analysis. Rather than repeatedly downloading and processing large image archives for each project, a user can work from reusable representations and train a smaller model for a particular mapping task. That may help researchers and organizations without dedicated GPU resources or large data-storage capacity test satellite-based approaches.
The convenience does not remove the need to check results. Embeddings are model-generated representations, not direct explanations of what caused a landscape change. Their usefulness depends on the location, task, available labels and quality of supporting data. The team’s evaluation counts offer an initial comparison, but independent tests would help determine whether the reported advantage holds across new regions and operational uses.
The developers also say the model weights, pretraining data and code are available. They estimate that reproducing the final pretraining run for OlmoEarth v1.3 Base would cost about $2,720 in rented H100 computing time. That is the team’s estimate; actual expenses can vary by provider, hardware availability and setup, and it is not a cost estimate for every user’s mapping project.
satellite imagery analysis software
As an affiliate, we earn on qualifying purchases.
As an affiliate, we earn on qualifying purchases.
Earlier OlmoEarth workflows centered on fine-tuning a model for a particular task in OlmoEarth Studio, then running it over imagery to produce a map. According to the team, that approach requires GPU access and downloading and storing satellite images. Embeddings offer a different workflow: process imagery into reusable vectors, then use those vectors for different mapping questions or compare them across years.
The team says v1.3 used 53% of the computing time of v1.2 and 18% of the computing time of the original v1 to train. It also reports emissions equal to 50% of v1.2 and 22% of v1, and says v1.3 matches v1.2 in fine-tuning performance across research and partner labels. These are developer-reported comparisons; the supplied material does not provide the underlying emissions-accounting details.
The release describes an example from Madre de Dios, Peru, comparing maps from 2017–2020 with those from 2020–2025 around La Pampa. The team points to changes in an area associated with mining expansion and later shifts. The example cites Amazon Conservation’s MAAP monitoring and the 2019 Operation Mercurio crackdown. The embeddings can signal changes in the imagery, but by themselves do not establish that mining caused them or explain why they occurred.
“OlmoEarth’s 128-dimensional embeddings score highest on 20 of 27 evals and rank highest overall.”
— The OlmoEarth team
Questions About Validation and Coverage
The supplied release material does not include an independent replication of the 27 evaluations. The team’s technical report is cited as the source for methodology and full results, but evaluation-task selection and performance differences between regions are relevant when judging whether the model suits a specific application.
The material also does not specify how often annual embeddings will be updated, what data gaps or quality limitations apply in particular locations, or what access and computing requirements users may face for large-scale work. The Peru example illustrates a further limit: a difference between annual embeddings indicates a change in the mapped data, but attributing it to mining, recovery or another cause requires corroboration from imagery, monitoring records or field evidence. The supplied source does not establish the model’s performance for every location or use case.
Independent Tests and Data Updates
The team points users to its technical report for the evaluation methods and results, and to Source Cooperative for the precomputed embeddings. Researchers and other users can test the released data and explorer on specific regions and tasks, then compare outputs with imagery, labeled datasets and other monitoring sources.
No schedule for future data updates or independent benchmark review is specified in the supplied material. Further evidence about regional performance, data coverage, update frequency and practical access requirements will help users decide whether OlmoEarth v1.3 is appropriate for research or operational mapping.
Key Questions
What did the OlmoEarth team release?
The release includes OlmoEarth v1.3, annual global satellite embeddings at 10-meter resolution, and a browser-based explorer for viewing and working with the maps.
What is an OlmoEarth embedding?
An embedding is a numerical representation learned from imagery. OlmoEarth v1.3 produces a 128-number vector for each 10-meter pixel, with the first 64 dimensions available as a smaller representation.
How strong were the reported evaluation results?
The team says the 128-dimensional version ranked highest on 20 of 27 evaluations, while the 64-dimensional version led in 18. These are the developers’ results; the supplied material does not report an independent replication.
Can the maps identify why a landscape changed?
Not by themselves. Differences in embeddings can indicate change in the satellite data, but identifying a cause—such as mining—requires confirmation from other evidence, including imagery, monitoring records or field data.
Where can users access the embeddings?
The team says the precomputed data is available through Source Cooperative. The release also includes a browser-based explorer for viewing maps and trying selected analysis features.
Primary source: Hugging Face · via ThorstenMeyerAI.com
Halloween Picks
halloween
As an affiliate, we earn on qualifying purchases.