
MVRV on TradingView is a key tool for predicting market crashes. It compares Bitcoin's market value to its realized value, helping you gauge if it's overvalued or undervalued. High MVRV values alert you to potential market tops, while low values can indicate bottoms. By monitoring MVRV, you can time your trades more effectively and manage risks. Discover how to utilize this metric further to enhance your trading strategies and stay ahead of market trends.
Key Takeaways
- MVRV ratio indicates overbought or oversold conditions, helping traders identify potential market crashes.
- High MVRV Z-scores historically signal market tops, alerting to possible downturns.
- TradingView offers real-time visualization of MVRV, facilitating continuous market monitoring.
- Combining MVRV with other on-chain metrics enhances crash prediction accuracy.
- Frequent analysis of MVRV aids traders in making timely, informed decisions during volatile periods.
MVRV, or Market Value to Realized Value, is a powerful metric for Bitcoin traders looking to gauge the asset's valuation. Essentially, it compares Bitcoin's current market capitalization—calculated by multiplying the current price of Bitcoin by the number of coins in circulation—with its realized value, which represents the total cost basis of all available Bitcoins. This realized value is determined by aggregating the prices at which Bitcoins were last moved between wallets.
By calculating the MVRV ratio, you can identify whether Bitcoin is overvalued or undervalued compared to its historical transaction data.
The MVRV Z-score takes this a step further. It uses the MVRV ratio along with standard deviation to pinpoint extreme deviations between market value and realized value. This advanced metric helps you identify periods of high risk, indicating potential market tops or bottoms. Historically, high MVRV values have signaled overvaluation, while low values have pointed toward undervaluation. Utilizing this information can guide your decisions on when to accumulate or sell Bitcoin. Additionally, significant market cycle tops typically occur when the score exceeds six, highlighting the importance of monitoring this metric.
When you're analyzing market trends, the MVRV ratio provides significant insights. It can help you spot overbought or oversold conditions within the market, allowing you to make more informed trading decisions. This predictive capability is crucial for managing risk, especially in a market known for its volatility.
The MVRV Z-score can alert you to extreme market conditions, helping you navigate potential crashes before they happen.
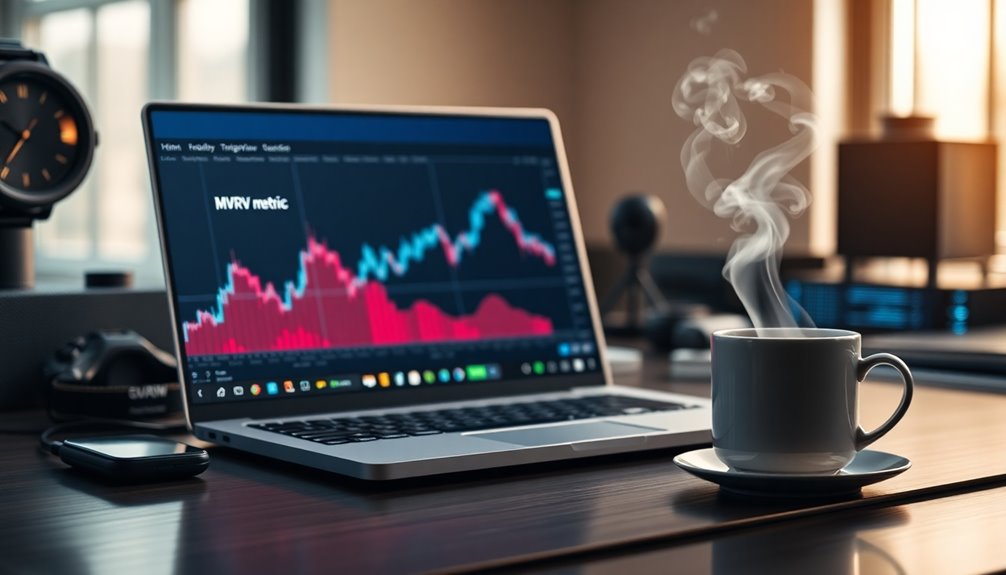
You can find the MVRV metric on TradingView, which allows you to visualize the ratio and Z-score in real-time. This integration offers a user-friendly platform to monitor Bitcoin's valuation continuously.
Moreover, combining the MVRV ratio with other on-chain metrics can provide you with deeper insights into market trends and cycles, enhancing your overall trading strategy.
Top picks for "mvrv tradingview metric"
Open Amazon search results for this keyword.
As an affiliate, we earn on qualifying purchases.
Frequently Asked Questions
How Is MVRV Calculated in Tradingview?
To calculate MVRV in TradingView, you first gather the current market capitalization and the realized capitalization of Bitcoin.
Then, divide the market value by the realized value to get the MVRV ratio.
Next, interpret this ratio by comparing it to historical data to see if Bitcoin's overvalued or undervalued.
You can also adjust for volatility using the MVRV Z-Score for a more nuanced analysis.
Can MVRV Predict Short-Term Market Fluctuations?
MVRV isn't the best tool for predicting short-term market fluctuations. It relies on on-chain data, which lags behind immediate market changes.
You'll find that it's more effective for identifying broader trends than for quick shifts. While it can signal when the market is overheated or undervalued, combining MVRV with other indicators like RSI or MACD will give you a clearer picture of potential short-term movements.
What Assets Can I Analyze Using MVRV on Tradingview?
You can analyze several assets using MVRV on TradingView, including Bitcoin, Ethereum, and other cryptocurrencies.
By calculating the MVRV ratio, you gain insights into their overvaluation or undervaluation. This metric helps you assess market sentiment and manage risks effectively.
Additionally, you can customize the MVRV-Z indicator for specific cryptocurrencies, allowing for a tailored approach to investment decisions.
Always consider other factors alongside MVRV for a comprehensive analysis.
Is MVRV Suitable for All Types of Investors?
MVRV's definitely suitable for various types of investors.
For long-term investors, it helps gauge unrealized profits and market health.
Short-term traders find it useful for quick profit insights and trend identification.
Institutional investors can analyze aggregate behavior and assess risk effectively.
Retail investors, being less technical, appreciate its simplicity and market health insights.
How Often Should I Check MVRV for Updates?
You should check MVRV at least once a day, especially during volatile market conditions.
Frequent updates help you capture rapid changes in market behavior and value. If you're actively trading, consider checking it multiple times a day to spot potential tops or bottoms.
Setting up alerts for significant changes can also keep you informed without constant monitoring.
Conclusion
In conclusion, MVRV on TradingView is a powerful tool that can help you identify potential market crashes. By monitoring this metric, you can make informed decisions and adjust your investment strategy accordingly. Staying ahead of market trends is crucial, and understanding MVRV gives you an edge. So, keep an eye on this indicator, and you'll be better prepared to navigate the ups and downs of the market, protecting your investments along the way.